The Metric Narrative Handbook
Numbers tell a story, but only if you know how to read between the lines. This handbook provides the framework for turning raw data into business intelligence that drives real outcomes.

Core Principles of Data Narrative
Master these sections to eliminate interpretation errors and data silos.

What Does This Metric Actually Mean?
Move beyond names like 'Conversion Rate' to understand the specific triggers, user segments, and temporal factors that define the number.
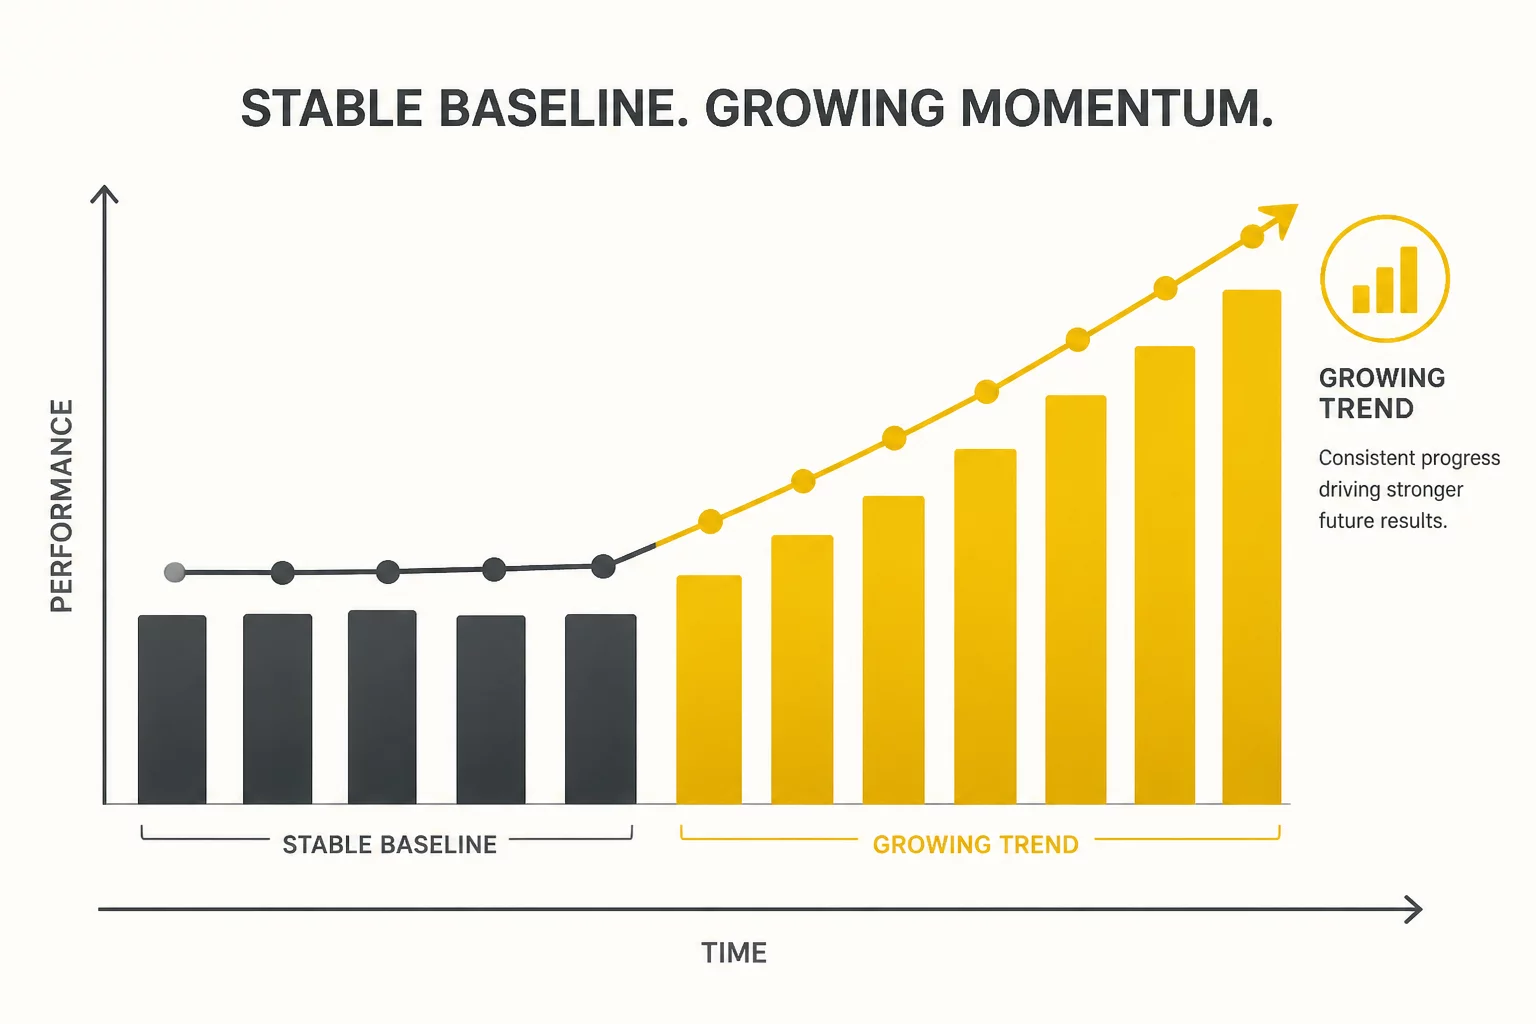
Baseline Before Trend
A 10% increase is meaningless without knowing if the starting point was an all-time low or a seasonal peak. Always establish the norm first.

Percentage Change Without Context
Avoid the small base bias. Learn how to report growth in a way that respects the scale of the original data set.

Metric vs. Business Outcome
High engagement doesn't always equal revenue. We bridge the gap between technical signals and executive goals.

The Definition Dilemma
When Sales and Marketing define 'Lead' differently, data integrity dies. Discover strategies for cross-team KPI alignment.

How to Explain Uncertainty
Confidence intervals aren't just for statisticians. Learn to communicate data variance to stakeholders without losing trust.
Metric Handoff Checklist
Before delivering a report, ensure every metric passes this 6-point narrative audit.
Definition Alignment
Have all stakeholders agreed on the mathematical formula?
Baseline Establishment
Is there a 12-month or seasonal baseline for comparison?
Data Hygiene Check
Have outliers and tracking anomalies been filtered or noted?
Contextual Weighting
Are percentages accompanied by absolute volume numbers?
Outcome Linkage
Does the metric directly correlate to a specific business P&L item?
Actionable Narrative
If this metric changes by 20%, is the next step clearly defined?